SHIELD Enhanced Returns Analysis

Target Return Analysis Based on Current Market Assumptions
Patent Pending: USPTO #63/807,771

Executive Summary

14.6%
Target IRR
$175M
Total Fund Size
20 Years
Investment Period
5 Years
Call Option

What You're Looking At

This template shows a 20-year projection of cash flows for the SHIELD Enhanced Portfolio. The analysis demonstrates what we expect to happen each year based on multiple income streams working together.

Diversified Income Streams

Death Benefits
$500M total
From life settlement policies as people pass away
Housing Income
$6.75M annually
From housing authority loans at 4.5% interest
ARNEX Strategy
$3.0M annually
From non-correlated investment returns
PHA Payments
$5.3M annually
From public housing authority operations
45L Credits
$1.2M annually
From affordable housing tax credits
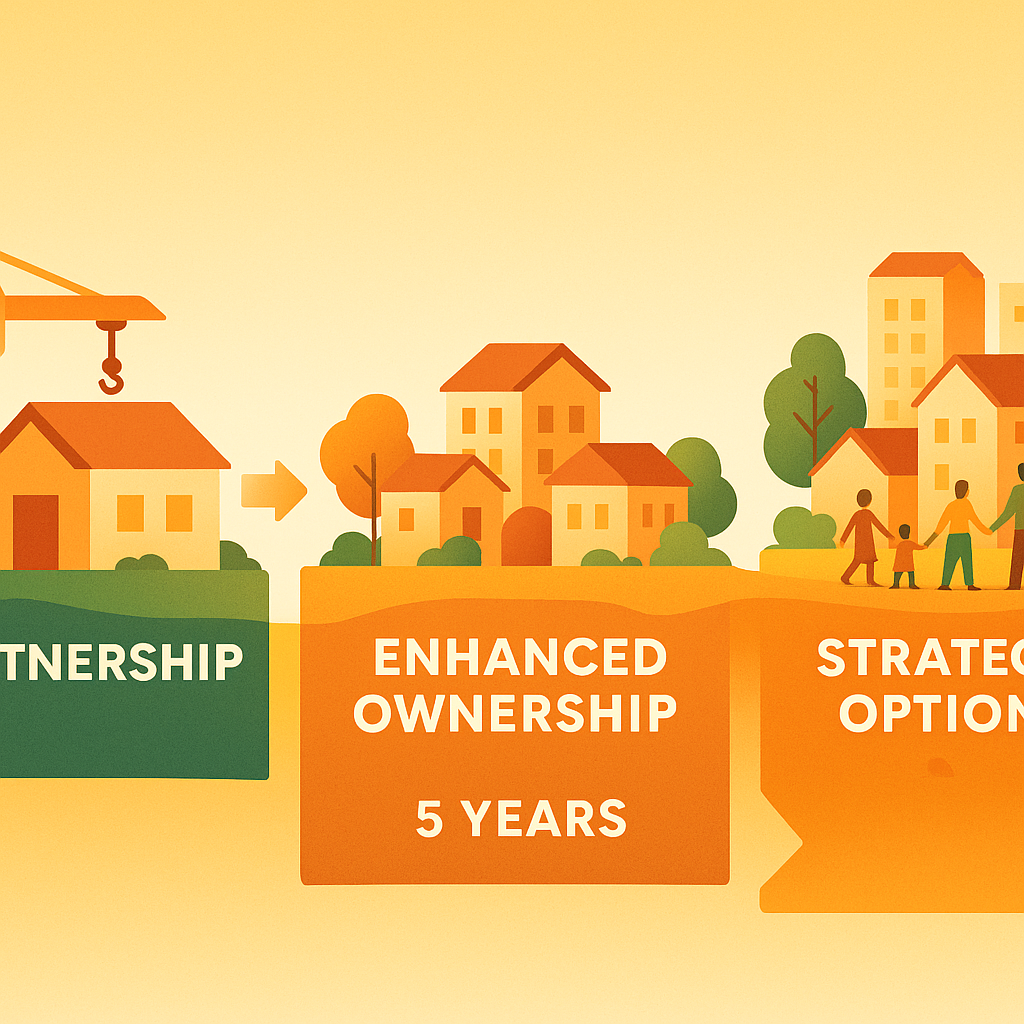
15% Equity Exit
$12.6M potential
From property ownership in Year 5

Fund Structure & Key Assumptions

Total Fund Size: $175M Initial investment
Life Settlement Cost: $125M (25% of face value)
ARNEX Strategy: $50M Non-correlated returns
Housing Principal: $150M Borrowed at par
Face Value: $500M (100 policies)
15% Equity Exit: $12.6M Year 5 strategic exit

Strategy Structure: $175M fund deploys $125M for life settlements ($500M face value), borrows $150M against settlements at par to fund housing authority loans at 4.5%, with $50M ARNEX reserve for non-correlated returns.

The Bottom Line

Multiple income streams working together target 14.6% returns over 20 years, with a 5-year exit option available for those who want liquidity sooner.

Target IRR: 14.6%
After fund management fees
Total Return Multiple: 2.21x
20-year projection
5-Year IRR: 10.2%
Call option return
Total Net Cash Flow: $580M
20-year cumulative

Industry Recognition of PHA Asset Building and Equity Participation

Supporting Evidence for SHIELD's Strategic Approach

The affordable housing industry is shifting toward PHA asset building and equity participation. Leading experts support SHIELD's approach to 30% PHA equity with clear paths to ownership.

Novogradac Findings

  • PHA Services: Provides entity structuring enabling PHAs as active participants
  • RAD Expertise: Confirms HUD requirements for PHA control post-conversion
  • Equity Analysis: LIHTC pricing data shows PHAs can act as investors

Strategic Alignment

SHIELD's 1.35 coverage ratio versus industry 1.11–1.15 improves PHA cash flow while maintaining returns.

Conclusion

Industry validation positions SHIELD as the logical next step in affordable housing finance for PHAs.

Visual Strategy Overview

The following visual elements demonstrate SHIELD's enhanced partnership approach through strategic imagery designed for immediate comprehension and emotional engagement. Each image conveys key concepts without cognitive overload, following proven principles of financial communication.

Enhanced Partnership Flow - Life insurance policies flowing to housing development

1. Enhanced Partnership Flow

Strategic Asset Flow Visualization

Strategic Purpose: Demonstrates enhanced funding flow and stability
Limbic Trigger: Partnership, strength, abundance

This visualization shows life insurance policies flowing seamlessly into a central fund reservoir through a golden pipeline, then connecting to strong, well-maintained public housing authority buildings. The imagery uses trustworthy deep blue tones and prosperity-associated gold to create an immediate sense of secure partnership and financial stability.

Partnership Evolution - Traditional vs Enhanced Collaboration

2. Partnership Evolution Comparison

Enhanced Collaboration Model

Strategic Purpose: Shows enhanced PHA partnership positioning
Limbic Trigger: Respect, equality, collaboration

A side-by-side comparison illustrating the evolution from traditional partnership models to SHIELD's enhanced approach. The left side shows traditional arrangements, while the right demonstrates the enhanced model with PHAs positioned as equal partners at the center of collaboration, surrounded by stronger financial connections and increased community representation.

Multiple Revenue Streams - Diversified income flowing to stable community

3. Multiple Revenue Streams Creating Stability

Diversified Income Foundation

Strategic Purpose: Diversified income stability
Limbic Trigger: Security, abundance, community prosperity

This visualization shows multiple substantial income streams flowing smoothly into a stable reservoir that feeds a thriving housing community. The harmonious composition emphasizes security through diversification, with well-maintained buildings and community elements conveying prosperity and abundance through multiple revenue sources.

Asset Building Timeline - Three stages from Partnership to Strategic Options

4. Asset Building Timeline

Long-Term Value Creation Path

Strategic Purpose: Long-term value creation and asset building
Limbic Trigger: Growth, progress, achievement

A three-stage timeline showing the progression from initial Partnership through Enhanced Ownership (5 years) to Strategic Options. The visualization demonstrates how the same housing development evolves and strengthens over time, with buildings and communities growing more established, families thriving, and strategic opportunities expanding.

Thriving Community - Upward growth from Partnership to Strategic Options

5. Thriving Community Outcome

Sustainable Community Success

Strategic Purpose: The ultimate outcome - sustainable community
Limbic Trigger: Belonging, pride, positive future

An upward progression visualization showing the journey from Partnership through Enhanced Ownership to Strategic Options. The imagery captures growth and advancement with an ascending path, demonstrating how communities develop from initial construction phases to mature, thriving neighborhoods with expanding opportunities and strategic value creation.

Visual Communication Strategy

Cognitive Load Optimization

Limited to 5 images maximum (Miller's Rule: 7±2 information chunks). Each image conveys one core concept without cognitive overload, following proven principles of working memory management.

Limbic Response Design

Colors and imagery trigger emotional engagement before rational analysis. Deep blues for trust, gold for prosperity, smooth curves and growth imagery activate reward circuits for instant positive response.

Sequential Storytelling

Images progress logically: Flow → Partnership → Stability → Growth → Success. Each builds understanding incrementally, preventing information overload while maintaining narrative coherence.

Diplomatic Messaging

Visuals emphasize enhancement and partnership rather than criticism of traditional methods. Same LIHTC investors and developers see opportunity for collaboration, not replacement of existing structures.

Financial Projections & Analysis

The following tables provide detailed 20-year financial projections for both levered and unlevered scenarios. These projections are based on current market assumptions and management's assessment of execution capabilities.

Note: The financial projection tables below are displayed at 90% viewport width for optimal readability and data visualization.

20-Year Financial Projection (50/50 Levered – Equity)

20‑Year Financial Projection (50 / 50 Levered – Equity)

YrIRR YTDNet CashCumul.Death Ben.PremiumsHousing +Loan –ARNEXPHA45LPrincipal15 % Exit
0N/A($175.0M)($175.0M)$0.0M$0M$0M$0M$0M$0M$0M$0M$0M
1N/A($20.5M)($195.5M)$0.0M($30.0M)$6.75M($6.75M)$3.0M$5.3M$1.2M$0M$0M
2-11.4%$19.8M($175.7M)$40.0M($30.0M)$6.75M($6.75M)$3.0M$5.3M$1.2M$0M$0M
31.4%$24.8M($150.9M)$45.0M($30.0M)$6.75M($6.75M)$3.0M$5.3M$1.2M$0M$0M
45.3%$29.8M($121.1M)$50.0M($30.0M)$6.75M($6.75M)$3.0M$5.3M$1.2M$0M$0M
510.8%$193.1M$72.0M$55.0M($30.0M)$6.75M($6.75M)$3.0M$5.3M$1.2M$150.0M$12.6M
612.6%$34.4M$106.4M$50.0M($18.6M)$0M$0M$3.0M$0M$0M$0M$0M
714.3%$22.4M$128.8M$35.0M($15.6M)$0M$0M$3.0M$0M$0M$0M$0M
815.2%$14.5M$143.3M$25.0M($13.5M)$0M$0M$3.0M$0M$0M$0M$0M
915.8%$21.0M$164.3M$30.0M($12.0M)$0M$0M$3.0M$0M$0M$0M$0M
1016.2%$22.8M$187.1M$30.0M($10.2M)$0M$0M$3.0M$0M$0M$0M$0M
1116.5%$24.6M$211.7M$30.0M($8.4M)$0M$0M$3.0M$0M$0M$0M$0M
1216.7%$21.4M$233.1M$25.0M($6.6M)$0M$0M$3.0M$0M$0M$0M$0M
1316.8%$17.9M$251.0M$20.0M($5.1M)$0M$0M$3.0M$0M$0M$0M$0M
1416.9%$19.1M$270.1M$20.0M($3.9M)$0M$0M$3.0M$0M$0M$0M$0M
1517.0%$15.3M$285.4M$15.0M($2.7M)$0M$0M$3.0M$0M$0M$0M$0M
1617.0%$11.2M$296.6M$10.0M($1.8M)$0M$0M$3.0M$0M$0M$0M$0M
1717.1%$11.8M$308.4M$10.0M($1.2M)$0M$0M$3.0M$0M$0M$0M$0M
1817.1%$7.4M$315.8M$5.0M($0.6M)$0M$0M$3.0M$0M$0M$0M$0M
1917.1%$7.7M$323.5M$5.0M($0.3M)$0M$0M$3.0M$0M$0M$0M$0M
2017.1%$3.0M$326.5M$0.0M$0M$0M$0M$3.0M$0M$0M$0M$0M
Levered Overview: Equity IRR crosses 10% by Year 5 (call‑option phase) and rises to ~17% gross (~14–15% net of fees) by Year 20. Loan principal and interest are covered by LS collateral and housing income.

20-Year Financial Projection (All-Cash / Unlevered)

20-Year Financial Projection (All-Cash / Unlevered)

YrIRR YTDNet CashCumul.Death Ben.PremiumsHousing +ARNEXPHA45LPrincipal15 % Exit
0N/A($325.0M)($325.0M)$0.0M$0M$0M$0M$0M$0M$0M$0M
1N/A($13.8M)($338.8M)$0.0M($30.0M)$6.75M$3.0M$5.3M$1.2M$0M$0M
2-7.0%$26.3M($312.5M)$40.0M($30.0M)$6.75M$3.0M$5.3M$1.2M$0M$0M
3-3.5%$31.3M($281.2M)$45.0M($30.0M)$6.75M$3.0M$5.3M$1.2M$0M$0M
4-0.5%$36.3M($244.9M)$50.0M($30.0M)$6.75M$3.0M$5.3M$1.2M$0M$0M
55.2%$203.8M($41.1M)$55.0M($30.0M)$6.75M$3.0M$5.3M$1.2M$150.0M$12.6M
66.4%$34.4M($6.7M)$50.0M($18.6M)$0M$3.0M$0M$0M$0M$0M
77.2%$22.4M$15.7M$35.0M($15.6M)$0M$3.0M$0M$0M$0M$0M
87.9%$14.5M$30.2M$25.0M($13.5M)$0M$3.0M$0M$0M$0M$0M
98.5%$21.0M$51.2M$30.0M($12.0M)$0M$3.0M$0M$0M$0M$0M
109.0%$22.8M$74.0M$30.0M($10.2M)$0M$3.0M$0M$0M$0M$0M
119.5%$24.6M$98.6M$30.0M($8.4M)$0M$3.0M$0M$0M$0M$0M
1210.0%$21.4M$120.0M$25.0M($6.6M)$0M$3.0M$0M$0M$0M$0M
1310.3%$17.9M$137.9M$20.0M($5.1M)$0M$3.0M$0M$0M$0M$0M
1410.5%$19.1M$157.0M$20.0M($3.9M)$0M$3.0M$0M$0M$0M$0M
1510.6%$15.3M$172.3M$15.0M($2.7M)$0M$3.0M$0M$0M$0M$0M
1610.7%$11.2M$183.5M$10.0M($1.8M)$0M$3.0M$0M$0M$0M$0M
1710.8%$11.8M$195.3M$10.0M($1.2M)$0M$3.0M$0M$0M$0M$0M
1810.8%$7.4M$202.7M$5.0M($0.6M)$0M$3.0M$0M$0M$0M$0M
1910.9%$7.7M$210.4M$5.0M($0.3M)$0M$3.0M$0M$0M$0M$0M
2010.9%$3.0M$213.4M$0.0M$0M$0M$3.0M$0M$0M$0M$0M
Unlevered Overview: IRR crosses 5% at Year 5 with the call-option exit. Over 20 years, the IRR stabilizes around 10.9% net of premiums, reflecting long-duration life settlement realization.

Summary Metrics (20-Year Projection)

Total Death Benefits: $500M
Life settlement payouts
Total Premium Costs: ($180M)
Insurance premiums
Principal Recovery: $150M
Year 5 recovery
15% Equity Exit: $12.6M
Year 5 strategic exit

Investment Overview: SHIELD combines life settlements with affordable housing development to create diversified returns through multiple income streams and a 5-year call option for liquidity. Returns depend on mortality timing, which is inherently unpredictable. Year 1 shows a stress scenario with zero deaths.

Important Disclaimers & Risk Factors

Important Disclaimers: All projections are based on current market assumptions and management's assessment of execution capabilities. Actual results may vary materially from these projections. Past performance is not indicative of future results. All investments involve risk of loss, including loss of principal.

Key Risk Factors: Real estate market conditions, mortality timing uncertainty, interest rate environment, housing authority performance, and execution risk. Returns subject to successful implementation and favorable market conditions.